Using the Python Debugger (pdb): Step-by-Step Guide
You know the cycle. Something goes wrong, so you sprinkle print() statements through your code, rerun the script, stare at the output, and guess again. For…

Key topics
You know the cycle. Something goes wrong, so you sprinkle print() statements through your code, rerun the script, stare at the output, and guess again. For simple bugs, that works. But the moment your program grows past a few lines, print debugging turns into a slow game of hide-and-seek where you never quite see what you need.
The Python debugger, pdb, changes that. Instead of guessing what your code is doing, you can pause it at any line, inspect the live values, and step through execution one line at a time. And because pdb ships with Python itself, you already have it installed.
When Print Statements Stop Being Enough
Print statements are not wrong. They are the first debugging tool every Python learner reaches for, and they handle plenty of small problems. You add a print, run the script, read the output, and spot the issue.
The trouble starts when the bug hides inside a function that runs dozens of times, or when the wrong value appears only at a specific moment deep in the logic. Now you are stuck in a loop: add a print, rerun, remove the print, add another print somewhere else, rerun again. Each cycle costs time, and the prints themselves clutter the code you are trying to understand.
pdb gives you a better option. It pauses your program at a line you choose, right in the middle of the run. At that moment, you can look at any variable, check any expression, and move forward one line at a time. You are not guessing what the code is doing. You are watching it.
Your First Breakpoint: Stop, Inspect, Resume
The fastest way to start is to drop a breakpoint directly into your code. A breakpoint is a line that tells Python, "pause here so I can look around."
Save this file as total.py:
prices = [10, 20, 30]
total = 0
for price in prices:
    total += price
breakpoint()
print(total)
Now run it:
python total.py
Instead of printing 60 and finishing, the program stops at the breakpoint() line and shows you this:
> /path/to/total.py(5)<module>()
-> print(total)
(Pdb)
That (Pdb) prompt is the signal that your program is paused and waiting for your command. This is the moment print debugging cannot give you: the program is alive, frozen mid-run, and you can ask it what it knows.
Type this to inspect the total variable:
(Pdb) p total
60
The p command prints the value of any variable or expression. Now type c to continue:
(Pdb) c
60
The program finishes normally. That is the whole stop-inspect-resume cycle, and every pdb session follows it. Pause. Look at the values. Decide what to do next.
Since Python 3.7, breakpoint() is the clean way to do this. In older code you may also see import pdb; pdb.set_trace(), which does the same thing. I recommend using breakpoint() in modern code. It is shorter, and you do not need the import line cluttering your file.
Knowledge check
Check your understanding
Answer this question before you continue.
Running the Whole Script Under pdb
Sometimes you do not know where the bug is, so you want to trace the entire program from the start. Run your script with the -m pdb flag:
python -m pdb total.py
The debugger loads your script and pauses before the first line executes:
> /path/to/total.py(1)<module>()
-> prices = [10, 20, 30]
(Pdb)
From here you can step through the whole program and watch what happens at every line. This approach is useful when the bug could be anywhere. When you already suspect a specific spot, breakpoint() gets you there faster.
Knowledge check
Check your understanding
Answer this question before you continue.
Your First pdb Commands: next, step, and continue
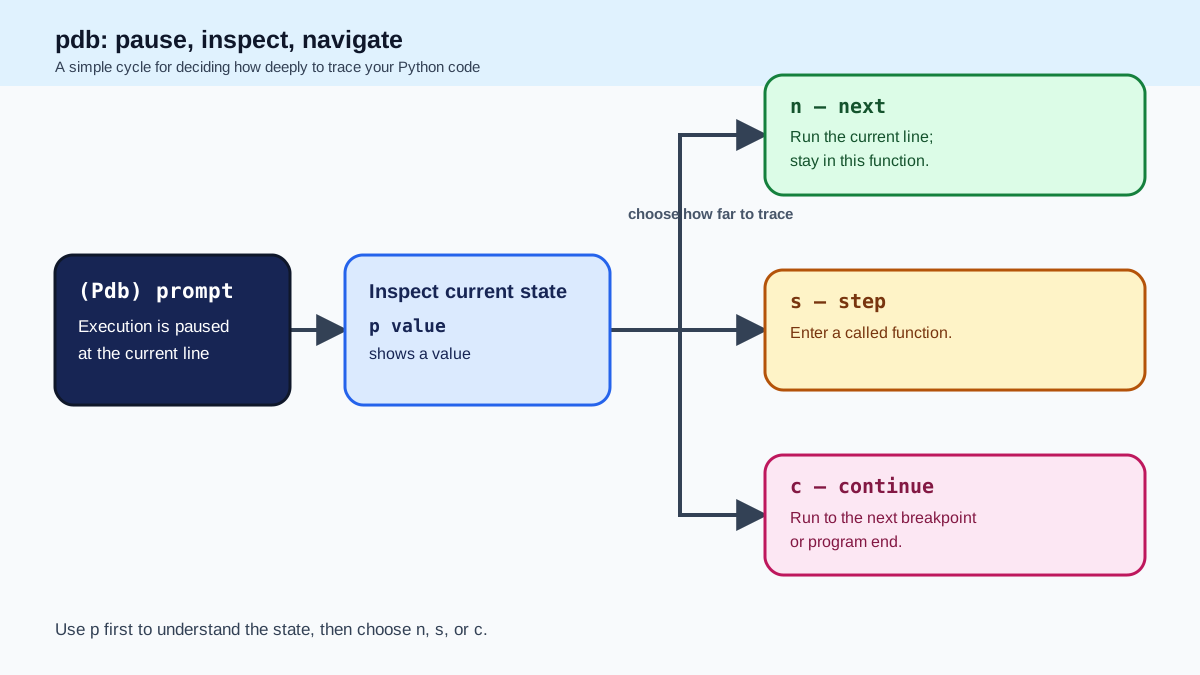
Once you see the (Pdb) prompt, you need three commands to navigate your code. They are the core of stepping through code with pdb.
| Command | Shorthand | What it does |
|---|---|---|
next | n | Run the current line and stop at the next line in the same function |
step | s | Step into a function call to trace what happens inside it |
continue | c | Run until the next breakpoint or the end of the program |
The difference between next and step confuses almost every beginner, so let us make it concrete. Save this file as tax.py:
def add_tax(price):
    return price * 1.1

total = 100
total = add_tax(total)
print(total)
Run it under the debugger:
python -m pdb tax.py
> /path/to/tax.py(1)<module>()
-> def add_tax(price):
(Pdb)
Type n twice to move past the function definition and reach the line that calls add_tax:
(Pdb) n
> /path/to/tax.py(3)<module>()
-> total = 100
(Pdb) n
> /path/to/tax.py(4)<module>()
-> total = add_tax(total)
(Pdb)
Now you face the choice. If you type n again, Python runs the entire add_tax function at full speed and stops at the next line in the main program:
(Pdb) n
> /path/to/tax.py(5)<module>()
-> print(total)
(Pdb)
But if you type s instead, the debugger jumps inside add_tax so you can watch what happens line by line inside the function:
(Pdb) s
--Call--
> /path/to/tax.py(1)add_tax()
-> def add_tax(price):
(Pdb)
Notice the difference. next treats the function call as one step and skips over it. step enters the function and pauses at its first line. Use next when you trust the function and only care about the result. Use step when the bug might be hiding inside that function and you need to trace it.
Knowledge check
Check your understanding
Answer this question before you continue.
Inspecting Values While Paused
Pausing execution is only half the payoff. The real power of pdb is that you can inspect variables and expressions at the exact moment the program is stopped.
| Command | Shorthand | What it does |
|---|---|---|
print | p | Evaluate and display an expression or variable |
pretty print | pp | Format large structures like lists and dictionaries readably |
list | l | Show the surrounding source code so you know where you are |
Imagine you have a function that builds a list of discounted prices, but the output is wrong. Save this file as discounts.py:
def apply_discounts(prices):
    discounted = []
    for price in prices:
        discounted_price = price * 0.9
        discounted.append(discounted_price)
    breakpoint()
    return discounted

print(apply_discounts([100, 200, 300]))
Run it:
python discounts.py
The program pauses at the breakpoint() line. Now you can inspect the values that exist at this moment:
(Pdb) p discounted
[90.0, 180.0, 270.0]
(Pdb) p len(discounted)
3
(Pdb) p discounted[0]
90.0
This is where pdb beats print statements. You can check the whole list, ask for its length, or pull out a single element, all without editing your code and rerunning.
For larger structures, pp formats the output so it is actually readable:
(Pdb) pp discounted
[90.0, 180.0, 270.0]
And if you lose your bearings, l shows the source code around your current line, with an arrow pointing at where execution is paused:
(Pdb) l
  4         for price in prices:
  5             discounted_price = price * 0.9
  6             discounted.append(discounted_price)
  7     breakpoint()
  8     return discounted
  9
 10 -> print(apply_discounts([100, 200, 300]))
(Pdb)
The arrow points at the line that will run next, not the line that just ran. That distinction matters when you are tracing through a loop: the arrow shows you where the program is going, and the values you inspect show you what the program has already done.
The Loop Problem: Pause at the Right Moment
Here is a subtle point that trips up beginners. In the discounts.py example, the breakpoint sits after the loop finishes. At that moment, you can see the final result, but you cannot see what happened during each iteration.
In Python, the loop variable price stays bound after the loop ends, so you can still inspect its last value:
(Pdb) p price
300
But that only shows you the final iteration. If the bug happens on the second iteration, you will never see it from a breakpoint placed after the loop.
The fix is to pause inside the loop. Move the breakpoint() into the loop body:
def apply_discounts(prices):
    discounted = []
    for price in prices:
        discounted_price = price * 0.9
        breakpoint()
        discounted.append(discounted_price)
    return discounted

print(apply_discounts([100, 200, 300]))
Now the program pauses on every iteration, and you can watch price and discounted_price change each time:
(Pdb) p price
100
(Pdb) p discounted_price
90.0
(Pdb) c
(Pdb) p price
200
(Pdb) p discounted_price
180.0
(Pdb) c
(Pdb) p price
300
(Pdb) p discounted_price
270.0
(Pdb) c
[90.0, 180.0, 270.0]
This is the real debugging lesson: pdb is only as useful as the moment you choose to pause. If the wrong value appears during a specific iteration, pause inside that loop, not after it.
Knowledge check
Check your understanding
Answer this question before you continue.
Common Beginner Mistakes with pdb
A few mistakes will trip you up in your first debugging sessions. Here is what to watch for.
Forgetting to Remove Breakpoints
breakpoint() stops your program every time it runs. If you leave one in code that ships to production, your program will pause and wait for input that never comes.
The fix: Search for breakpoint and pdb.set_trace before you commit or deploy, and remove every one of them.
Confusing next and step
If you press s when you meant n, the debugger jumps into a function you did not want to explore. You suddenly see --Call-- and a stack of unfamiliar lines.
The fix: When that happens, press r to run until the current function returns, or press c to continue to the next breakpoint. Then slow down and choose deliberately: n stays in the current function, s goes inside called functions.
Typing Python Code Without the p Prefix
Inside the (Pdb) prompt, you cannot just type price * 2 and expect a result. The debugger treats bare input as a command, and it will complain.
The fix: Use p price * 2 or pp discounted. The p and pp prefixes tell the debugger you want to evaluate a Python expression.
Not Knowing How to Quit
When you are done debugging, you do not close the terminal and hope for the best.
The fix: Type q to quit the debugger and end the program immediately.
Practice: Debug a Small Bug with pdb
Time to put these commands to work. Here is a short script with a deliberate bug. The function should return the average of a list of numbers, but it produces the wrong result:
def average(numbers):
    total = 0
    for number in numbers:
        total += number
    return total / len(numbers) - 1

scores = [80, 90, 75, 95]
result = average(scores)
print(result)
Run this script and you will see it prints 84.0. The correct average of [80, 90, 75, 95] is 85.0, so something is off by one.
Add a breakpoint() line inside the function, right before the return statement, then run the script again:
def average(numbers):
    total = 0
    for number in numbers:
        total += number
    breakpoint()
    return total / len(numbers) - 1

scores = [80, 90, 75, 95]
result = average(scores)
print(result)
When the program pauses, inspect the values:
(Pdb) p total
340
(Pdb) p len(numbers)
4
(Pdb) p total / len(numbers)
85.0
There is the bug. total / len(numbers) gives 85.0, which is correct. But the function returns total / len(numbers) - 1, which subtracts an extra 1 and produces 84.0. The - 1 does not belong there.
Remove the breakpoint() and fix the return line:
def average(numbers):
    total = 0
    for number in numbers:
        total += number
    return total / len(numbers)

scores = [80, 90, 75, 95]
result = average(scores)
print(result)
Run it again:
python average.py
85.0
That is the full debugging loop: stop at the suspicious line, inspect the values, spot the wrong assumption, fix the code, and rerun to confirm.
pdb Is a Skill That Compounds
Every debugging session with pdb teaches you something about your code that print statements cannot: the exact value at the exact moment it matters. The more you use it, the faster you move from "something is wrong" to "here is the exact value that is wrong."
Run the practice bug above, then reach for pdb the next time print debugging feels like guesswork. It will not take long before pausing your program to inspect live state feels like the natural way to debug—because it is.
Knowledge check
Final check
Finish the article by checking the ideas you just learned.
References
Research updated Sep 5, 2026
Want a more structured Python path?
Use the Python Starter Pack to turn scattered tutorials into a focused practice path.
Python Starter Pack
A compact LearnPyFast PDF pack covering what Python is, installation, your first program, running Python code, and Python versions.
- 5 curated chapters
- Enhanced PDF edition with bundle-only learning guidance
- Offline-friendly format for focused review
- Source article links for future online updates
Coming soon


