
How to Generate a Text Report with Python
You have data. Someone else needs to understand it. The fastest bridge between the two is a plain text report—a file you can email, save, or hand to a…

Key topics
You have data. Someone else needs to understand it. The fastest bridge between the two is a plain text report—a file you can email, save, or hand to a teammate without making them read your code.
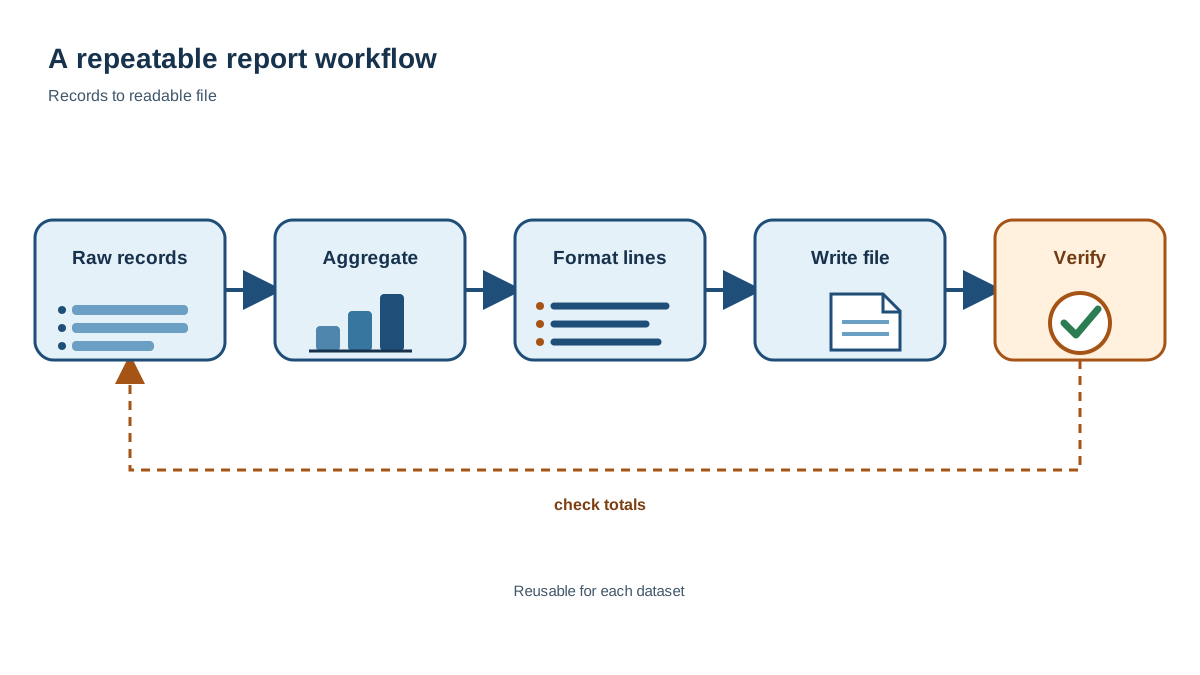
Here's the whole trick in one sentence: aggregate your records, format the results into readable lines, and write those lines to a file. Then check your work. In this cookbook, you'll build that exact workflow from scratch with a small dataset, and you'll end with a reusable pattern you can point at any future data.
What a Text Report Actually Is
A text report is a readable summary written to a .txt file. It is not just output printed to your screen. The difference matters: printed output disappears when the terminal closes, but a file persists. You can open it later, send it to someone, or compare it against a previous version.
Plain text is the right first report format for three reasons:
- No extra libraries. You use only Python's built-in tools.
- Opens anywhere. Every operating system and editor handles a
.txtfile. - Easy to compare. You can diff two report files to see what changed.
Fancier formats like PDF, HTML, or Excel reports are useful later, but they all require extra tools and more setup. When you're learning, plain text removes every obstacle between you and a working result.
Keep this mental model in your head for the rest of the article:
- Aggregate the raw records into summary numbers.
- Format those numbers into clean, readable lines.
- Write the lines to a file, then verify the file matches your source data.
Start with a Tiny Working Example
Let's see the whole loop before we examine any piece of it. Imagine you run a small coffee stand and you've tracked every sale as a tuple: the drink name and the price.
sales = [
    ("espresso", 3.50),
    ("latte", 4.75),
    ("espresso", 3.50),
    ("cappuccino", 4.25),
    ("latte", 4.75),
    ("espresso", 3.50),
]

# Aggregate: count drinks and total revenue
drink_counts = {}
drink_revenue = {}

for drink, price in sales:
    drink_counts[drink] = drink_counts.get(drink, 0) + 1
    drink_revenue[drink] = drink_revenue.get(drink, 0) + price

# Format: build readable lines
lines = []
lines.append("Coffee Stand Daily Report")
lines.append("=" * 30)
lines.append(f"{'Drink':<12} {'Count':>5} {'Revenue':>8}")
lines.append("-" * 30)

for drink in drink_counts:
    lines.append(f"{drink:<12} {drink_counts[drink]:>5} {drink_revenue[drink]:>8.2f}")

lines.append("-" * 30)

total_revenue = sum(price for _, price in sales)
lines.append(f"{'TOTAL':<12} {len(sales):>5} {total_revenue:>8.2f}")

# Write: save to a file
report_text = "\n".join(lines)
with open("sales_report.txt", "w") as file:
    file.write(report_text)

print("Report written to sales_report.txt")
Save this as make_report.py and run it:
python make_report.py
You should see:
Report written to sales_report.txt
Now open sales_report.txt in any text editor. You'll find:
Coffee Stand Daily Report
==============================
Drink        Count  Revenue
------------------------------
espresso         3    10.50
latte            2     9.50
cappuccino       1     4.25
------------------------------
TOTAL            6    24.25
That's a complete text report generated with Python. No external packages. No web framework. Just data in, readable file out.
Before we dig into each piece, here's a quick map of what the code does so you can read it in layers:
salesis your raw data: a list of drink-and-price pairs.- The two dictionaries,
drink_countsanddrink_revenue, hold your summary numbers. - The
lineslist collects every row of text you want in the report. - The
with open(...)block writes those lines to disk.
Everything else is either layout or shorthand. Keep those four pieces in mind and the code won't feel like one dense wall.
Aggregate the Records Before You Format
A report usually summarizes raw records rather than dumping them. Your coffee stand might sell two hundred drinks in a day; nobody wants to read two hundred lines. They want to know how many espressos sold and how much revenue they brought in.
That summarizing step is called aggregation, and dictionaries are the perfect tool for it. If dictionaries or for loops are unfamiliar, review those concepts first. Here, we'll focus on the pattern itself.
Look at the aggregation block from our example:
drink_counts = {}
drink_revenue = {}

for drink, price in sales:
    drink_counts[drink] = drink_counts.get(drink, 0) + 1
    drink_revenue[drink] = drink_revenue.get(drink, 0) + price
The .get(drink, 0) method is the key move. It says: "Give me the current count for this drink, or zero if the drink isn't in the dictionary yet." Then we add one to that value. The first time we see "espresso", the count becomes 0 + 1 = 1. The second time, it becomes 1 + 1 = 2.
The revenue dictionary follows the same pattern, but instead of adding 1, we add the drink's price.
Here's what the aggregation produces:
print(drink_counts)
print(drink_revenue)
{'espresso': 3, 'latte': 2, 'cappuccino': 1}
{'espresso': 10.5, 'latte': 9.5, 'cappuccino': 4.25}
Check those numbers against the original sales list. Three espressos at $3.50 each gives $10.50. Two lattes at $4.75 gives $9.50. One cappuccino at $4.25 gives $4.25. The math holds.
This is the moment to pause and verify your aggregation logic before you worry about formatting. If the dictionary is wrong, no amount of pretty formatting will fix the report.
Knowledge check
Check your understanding
Answer this question before you continue.
Format the Report Lines with f-Strings
Now you have aggregated data. The next step is turning it into lines that read like a real document, not like raw Python output.
The tool for this job is the f-string, which lets you embed values directly inside a string. Here, we'll use three formatting tricks that matter for reports:
lines.append(f"{'Drink':<12} {'Count':>5} {'Revenue':>8}")
The <12 left-aligns the drink name in a 12-character space. The >5 and >8 right-align the numbers so they line up in columns. This is what makes the report look organized instead of messy.
For the data rows:
lines.append(f"{drink:<12} {drink_counts[drink]:>5} {drink_revenue[drink]:>8.2f}")
The .2f formats the revenue with exactly two decimal places, so 10.5 becomes 10.50. Currency should always show two decimal places.
Finally, a total row gives the report a sense of completion:
total_revenue = sum(price for _, price in sales)
lines.append(f"{'TOTAL':<12} {len(sales):>5} {total_revenue:>8.2f}")
The len(sales) gives the total number of records. The sum(price for _, price in sales) line adds up every price in the original list. In plain English, that expression says: "For each sale in the list, grab the price, and add them all together." The underscore _ is a Python convention meaning "I don't care about this value"—in this case, the drink name, since you only need the price for the total.
A good beginner instinct is to build your report as a list of strings first, then join them once at the end. That keeps the logic easy to read and debug.
Knowledge check
Check your understanding
Answer this question before you continue.
Write the Report to a File
The formatted lines are ready. Now you need to get them out of memory and onto disk.
The standard way to write a file in Python uses the with statement:
report_text = "\n".join(lines)

with open("sales_report.txt", "w") as file:
    file.write(report_text)
Two details matter here.
First, "\n".join(lines) combines all your lines into one string with a newline character between each pair. Without those newlines, everything would land on a single line in the file.
Second, the with statement handles file closing for you. When the block ends, Python closes the file automatically. This prevents a classic beginner bug: forgetting to close the file, which can leave it locked or incompletely written.
The "w" mode means "write mode." Python will create the file if it doesn't exist, or overwrite it completely if it does. That's what you want for a report you regenerate each day. Just be aware: every run replaces the previous file.
The file lands in the same directory as your script. If you run python make_report.py from your project folder, you'll find sales_report.txt right next to make_report.py.
Knowledge check
Check your understanding
Answer this question before you continue.
Verify the Report Matches Your Data
A report you never read back can silently be wrong. Maybe your aggregation missed a record. Maybe a price was mistyped. The file looks fine when you skim it, but the numbers don't match reality.
The fix is a lightweight verification habit. After writing the file, reopen it and confirm the contents:
with open("sales_report.txt", "r") as file:
    contents = file.read()

print(contents)
You should see the same report you viewed earlier. Now do the manual check: count the records in your source data and confirm the report's total matches.
In our example, the source data has six sales. The report says TOTAL 6 24.25. Add up the prices yourself: 3.50 + 4.75 + 3.50 + 4.25 + 4.75 + 3.50 = 24.25. The report matches the source.
But manual checks only catch what you remember to look for. A stronger habit is to make the script check its own math. Add this right after you write the file:
expected_count = len(sales)
expected_revenue = round(sum(price for _, price in sales), 2)

if expected_count == 6 and expected_revenue == 24.25:
    print("Verification passed: report totals match source data.")
else:
    print("Verification failed: check your aggregation logic.")
This works for a fixed example, but you can make it general by comparing against the values you already calculated:
if len(sales) == sum(drink_counts.values()):
    print("Verification passed: every record was counted.")
else:
    print("Verification failed: some records were missed.")
The idea is simple: your script already knows the truth from the source data. Have it confirm that the numbers it's about to write actually agree with that truth. Manual inspection is still useful for checking layout and readability, but numeric checks catch data mistakes automatically.
This habit—read the file back, check the numbers against the source—is what separates a demo from a report you can trust. It takes ten seconds and catches real mistakes.
Knowledge check
Check your understanding
Answer this question before you continue.
Common Beginner Mistakes
Every beginner hits these. Here's what they look like and how to fix them.
Forgetting that f-strings handle conversion for you. In an f-string, you can embed numbers directly: f"{drink_counts[drink]:>5}" works fine. But if you build strings with the + operator, you'll hit TypeError: can only concatenate str. The fix: use f-strings for anything that mixes text and numbers.
Overwriting your file accidentally. Write mode ("w") replaces the entire file every time. If you need to keep previous reports, use a filename with a date stamp, like sales_report_2025-01-15.txt, or switch to append mode ("a") when that's the right behavior.
Missing newlines. If you write each line without joining them with "\n", the entire report collapses into one long line. Remember: "\n".join(lines) is your friend.
Forgetting to close the file. If you use open() without with, you must call file.close() yourself. Forgetting leaves the file locked or incompletely written. The with statement eliminates this entire class of bug.
Two Variations to Make It Reusable
The script you built works, but it's tied to one hardcoded dataset. Here are two beginner-safe variations that move you toward a reusable report generator.
Variation 1: Wrap the logic in a function.
def generate_sales_report(sales, filename="sales_report.txt"):
    drink_counts = {}
    drink_revenue = {}

    for drink, price in sales:
        drink_counts[drink] = drink_counts.get(drink, 0) + 1
        drink_revenue[drink] = drink_revenue.get(drink, 0) + price

    lines = []
    lines.append("Coffee Stand Daily Report")
    lines.append("=" * 30)
    lines.append(f"{'Drink':<12} {'Count':>5} {'Revenue':>8}")
    lines.append("-" * 30)

    for drink in drink_counts:
        lines.append(f"{drink:<12} {drink_counts[drink]:>5} {drink_revenue[drink]:>8.2f}")

    lines.append("-" * 30)

    total_revenue = sum(price for _, price in sales)
    lines.append(f"{'TOTAL':<12} {len(sales):>5} {total_revenue:>8.2f}")

    with open(filename, "w") as file:
        file.write("\n".join(lines))

    print(f"Report written to {filename}")
Now you can call it with any list of sales:
generate_sales_report(sales)
generate_sales_report(sales, "morning_report.txt")
Notice that the function keeps the same aggregate-format-write structure. If you want the verification step to travel with it, add the count check before the with open block:
if len(sales) != sum(drink_counts.values()):
    print("Warning: record count mismatch before writing.")
Variation 2: Read the source records from a file.
Instead of hardcoding the sales list, read it from a CSV or text file. That way the script works on new data without editing the code.
The simple version is enough when you're exploring or working with a one-off dataset. The function version earns its keep the moment you generate the same report more than once. The file-based version matters when your data changes daily.
What to Try Next
Here's your practice task: change the dataset, add a new summary metric, and re-verify the file.
Start with the coffee stand example. Add a new drink to the sales list, or change some prices. Then add a new summary line—for example, the average price per drink. Regenerate the report and confirm the new numbers match your source data by hand.
When you're ready for a fuller build, apply the same report pattern to event counts from a log file or to a tool that saves and summarizes financial records. The pattern you just learned—aggregate, format, write, verify—transfers directly.
That pattern is the reusable skill. You'll use it again in CSV cleaning, in automation workflows, and anywhere data needs to become a document someone else can read.
Knowledge check
Final check
Finish the article by checking the ideas you just learned.
Research updated Sep 5, 2026
Want a more structured Python path?
Use the Python Starter Pack to turn scattered tutorials into a focused practice path.
Python Starter Pack
A compact LearnPyFast PDF pack covering what Python is, installation, your first program, running Python code, and Python versions.
- 5 curated chapters
- Enhanced PDF edition with bundle-only learning guidance
- Offline-friendly format for focused review
- Source article links for future online updates
Coming soon


